👉 NEET Biology Examination
👉 NEET Biology Tips
👉 NEET Biology Study Material
👉 UGC Net Study Material
Electrocardiogram (ECG)
- ECG is graphic record of the electric current produced by the excitation of the cardiac muscles.
- The instrument used to record the changes is an electrocardiograph.
- Waller (1887) first recorded the electrocardiogram but Einthoven (1903) studied ECG in details, therefore, he got Nobel Prize in 1924 for the discovery of ECG.
- He is also considered " father of the electrocardiography " (the device used)
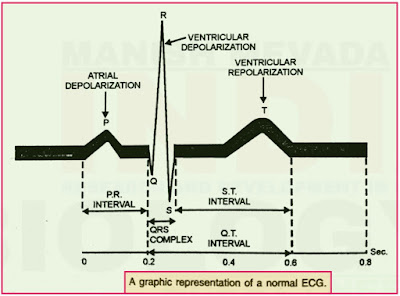
- A normal electrogram (ECG) is composed of a P wave, a QRS wave (complex ) and a T.wave.
- The letters are arbitrarily selected and do not stand for any particular words.
- The P Wave is a small upward wave that represents electrical excitation or the atrial depolarization which leads to contraction of both the atria (atrial contraction).
- It is caused by the activation of SA node. The impulses of contraction start from the SA node and spread throughout the artia.
- The QRS Wave (complex) begins after a fraction of second of the P wave.
- It begins as a small downward deflection (Q) and continues as large upright (R) and triangular wave, ending as downward wave (S) at its base.
- It represents ventricular depolarisation (ventricular contraction).
- It is caused by the impulses of the contraction from AV node through the bundle of His and Purkinje fibres and the contraction of the ventricular muscles.
- Thus this wave is due to the spread of electrical impulse through the ventricles.
- The T Wave is dome - shaped which represents ventricular repolarisation (ventricular relaxation).
- The potential generated by the recovery of the ventricle from the depolarisation state is called the repolarisation wave.
- The end of the T - wave marks the end of systole.
- Normal P - R interval is < 0.12 to 0.2 sec. Normal QRS complex duration is <0.10 sec.
- Normal Q - T interval is < 0.42 sec . Enlargement of the P Wave indicates enlargement of the artia. P - R interval (also called P Q interval) is the time required for an impulse to travel through the atria and AV node to the remaining conductive tissues.
- During atherosclerotic heart disease ( i.e. , formation of plaques and calcification) and rheumatic fever , the P - R interval is lengthened.
- This is due to the inflammation of atria and AV node.
- The enlarged Q and R waves indicate a myocardial infarction (heart attack).
- The S - T interval represents the time between the end of the spread of impulse through ventricles and its repolarisation.
- Thus, the s – T segment begins at the end of the Swave and terminates at the beginning of the T wave.
- The S - T segment is elevated in acute myocardial infarction and depressed when the heart muscle receives insufficient oxygen.
- T wave is flat when the heart muscles receive insufficient oxygen as in atherosclerotic heart disease.
- It may be elevated when the body's potassium level is increased.
- When ECG of a person is to be recorded , four leads (metal electrodes) are attached in the arms and legs.
- It is done after cleaning and putting a special jelly, which improves electrical conduction.
- With the help of a rubber suction cup, an additional electrode is placed on the chest.
- Now the electrocordiograph is switched on which detects and amplifies the electrical current of the heart and transmits to the recording pen.
- The latter draws a wavy line that is called the deflection waves (Electocardiogram).
- The importance of ECG is that it gives accurate information about the heart
- Therefore , ECG is of great diagnostic value in cardiac diseases .
========================================
Mail- indiabiologymanishmevada@gmail.com


Please do not enter any spam link or word in the comment box